
May 4, 2015 – For the first time, sources of carbon dioxide in Salt Lake County can be accurately estimated at the level of individual buildings and roads and by hour of the day. Building on this capability, mapping of toxic air pollutant emissions at such fine scale will also be possible.
Combining an advanced computer model with the results from long-term air quality monitoring, atmospheric scientists at the University of Utah say they can provide previously unattainable details on greenhouse gas and pollutant emissions in Salt Lake County. The capability has significant implications for health, sustainability and urban planning.
The goal is to deliver high-resolution maps and interactive data visualizations that can inform lawmakers, regulators and the public about the nature of emission sources and help identify better ways to reduce the health and environmental impacts, said Daniel Mendoza, an atmospheric sciences post-doctoral fellow at the U. Mendoza and John Lin, atmospheric sciences associate professor, and others unveiled the project today at the U.
Potential applications include:
- Assessing the potential impact of development and land-use decisions on air quality
- Informing decisions about energy investment, building codes and regulations limiting emissions.
- Understanding the health effects of air pollution and revealing the potential unequal burden of toxic exposure across neighborhoods.
Dr. Robert Paine, chief of pulmonary medicine at the U School of Medicine, detailed some of the health implications. Amy Wildermuth, the U’s chief sustainability officer, and Jay Baker of Envision Utah, highlighted uses in planning for growth at the neighborhood, city and regional scale. Representatives from the Utah Transit Authority, Division of Air Quality, Department of Transportation, Wasatch Front Regional Council, and University of Utah discussed how they plan to use the new tool to improve air quality.
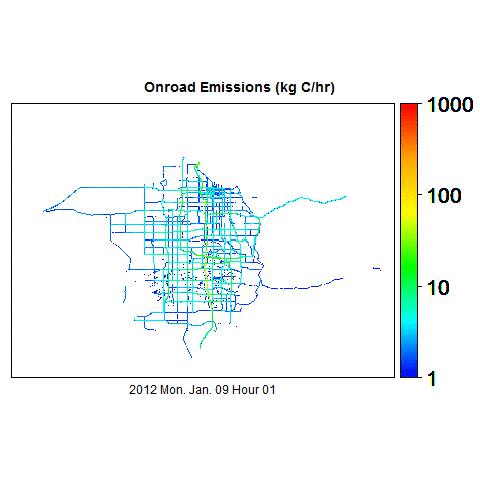
The computer model, called Hestia, was developed by Arizona State University researchers led by Kevin Gurney. It draws on data collected from many different domains: state-level emissions estimates, energy consumption reports, counts of traffic on city streets, and county tax assessor records detailing building sizes and uses. The computer model uses mathematical equations to estimate carbon dioxide emissions at the level of individual buildings and street segments. Salt Lake City and three other cities – Indianapolis, Los Angeles, Phoenix – are using Hestia to model emissions.
“Hestia is able to give us very fine, detailed analysis,” said Mendoza. “You can start to really visualize the urban metabolism.”
In Utah, Mendoza and colleagues are ground-truthing the model’s accuracy with direct measurements from an unusually dense array of instruments. Salt Lake City has one of the longest, continuously monitored records of urban carbon dioxide concentrations, an effort the University of Utah started in 2001 with equipment mounted on buildings and towers across the metropolitan area. Last year, the researchers added mobile measurements taken from instruments mounted on TRAX trains – the first such monitoring in the U.S. Results are recorded continuously at intervals of seconds or minutes, yielding a detailed look at how pollutants, including hydrocarbons and fine particulates, vary across time and space.
Hestia was initially developed to map carbon dioxide emissions, but the Utah researchers are adapting it to track other pollutants dangerous to human health and compare emissions and exposures across neighborhoods. “Since carbon dioxide is co-emitted with other pollutants, an understanding of carbon dioxide will naturally lead to better estimates of pollutant emissions,” Mendoza said. Top priorities are pollutants such as carbon monoxide, lead, fine particulate matter, and nitrogen and sulfur oxides.