
Feb. 24, 2011–Census data from Utah is being analyzed closely by the University of Utah’s Bureau of Economic and Business Research (BEBR) because of its potential to reshape the state’s political boundaries. The Census Bureau today also shipped local 2010 census data to the governor and leadership of the state legislature in Utah.
The data includes summaries of population totals, as well as data on race, Hispanic origin and voting age for multiple areas within the state, such as census blocks, tracts, voting districts, cities, counties and school districts.
Highlights of the Utah data include:
- The state population increased by over a half a million from 2000 to 2010 (530,716 – from 2,233,169 to 2,763,885). This is an increase of 24 percent.
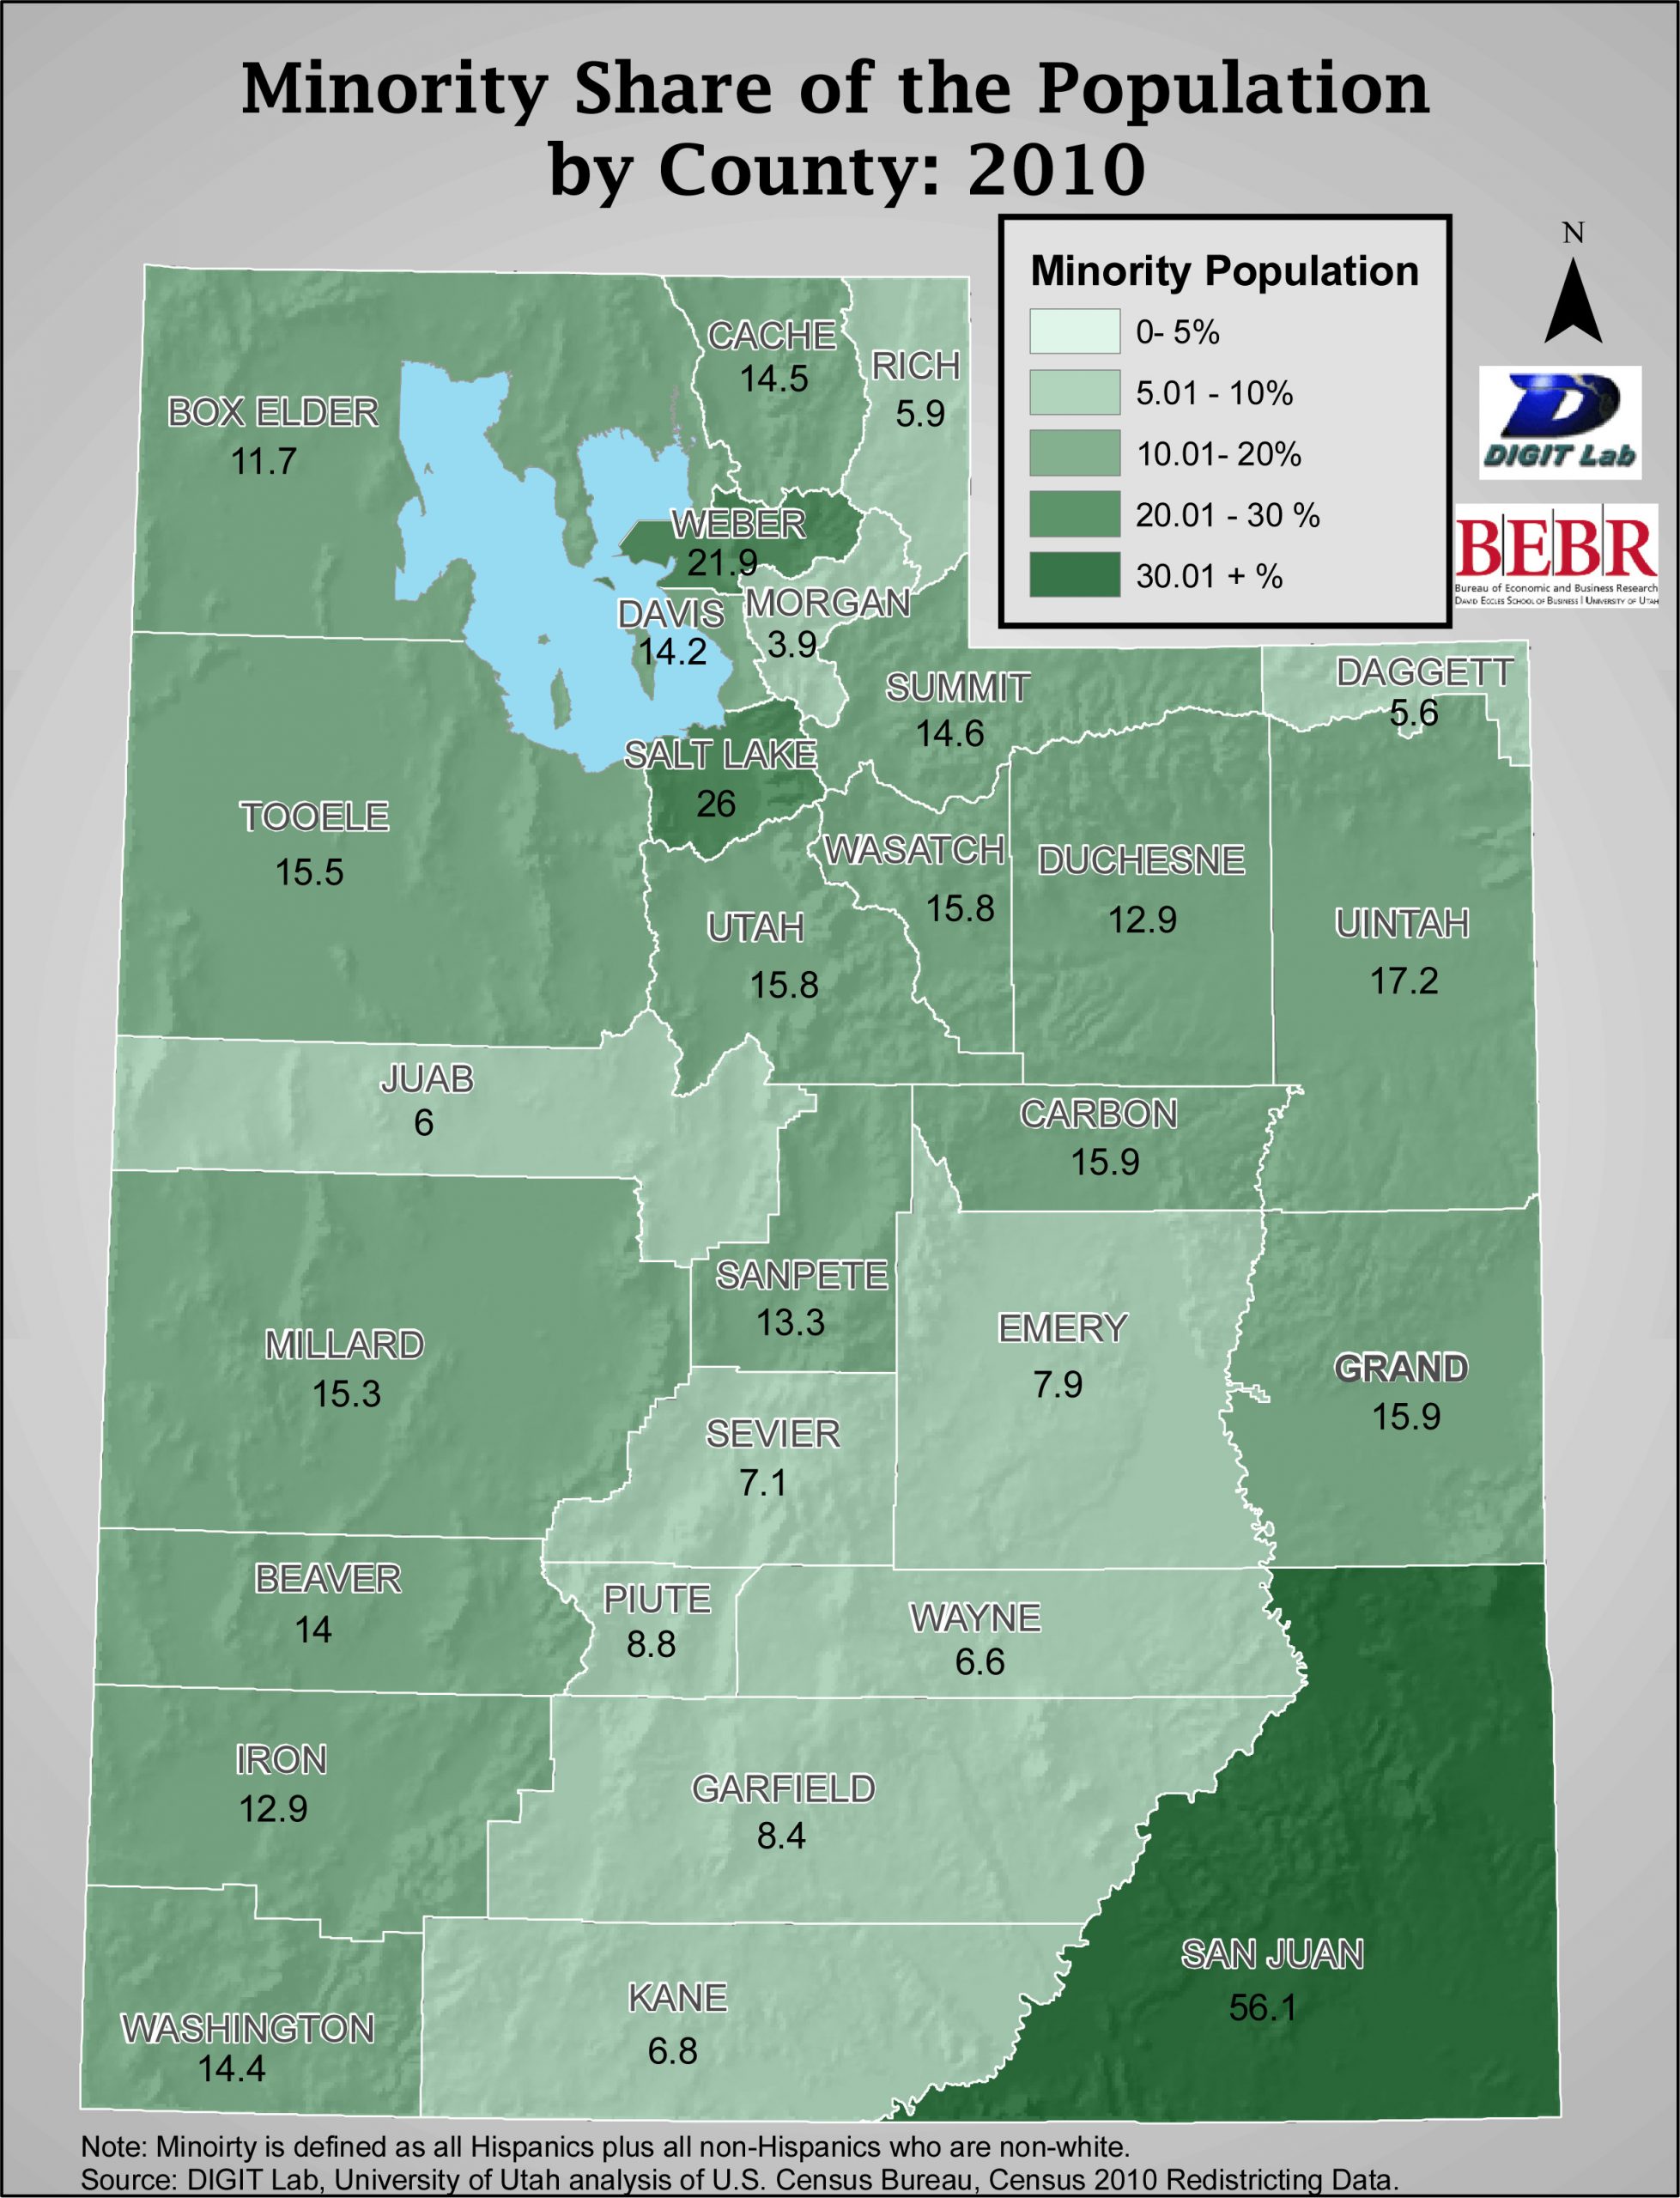
- Minorities (all Hispanics and non-whites):
- Total over half a million (542,166) and now 1 in 5 Utah persons, up from 328,904 or 15 percent of the population in 2000.
- Accounted for 40 percent of the overall population increase – minority population rose by 213,262 from 2000 to 2010 (328,904 in 2000 to 542,166 in 2010, a 65 percent increase from 2000 to 2010.
- Hispanics:
- Are the largest minority population, with a population of 358,340 in the 2010 Census, and representing two thirds of all minorities.
- Increased from 201,559 to 356,340, an increase of 156,781 or 78 percent.
- Contributed 30 percent of the increase in the state’s population from 2000 to 2010.
The youth of Utah are at the forefront of the state’s demographic transformation:
- Nearly 1 in 4 Utah youth in the 2010 Census were minority kids.
- 871,027 persons in Utah are younger than 18 (an increase of 152,329 or 21 percent from 2000.)
- 212,876 or 24 percent are minority kids.
- 143,846 or 17 percent are Hispanic or Latino.
According to law, the Census Bureau must provide redistricting data to the 50 states no later than April 1 of the year following the census. As a result, the Census Bureau is delivering the data state-by-state on a flow basis in February and March. Utah is one of the first states to receive its figures and all states will receive their data by April 1.
For more information on the Census Bureau’s Redistricting Data Program, visit http://www.census.gov/rdo and http://2010.census.gov/news/press-kits/redistricting.html.
Please visit http://2010.census.gov/2010census/data/ for an interactive map showcasing county-level population change from 1960 to 2010, as well as state-level data on race and Hispanic or Latino origin for 2010. The widget will be updated as states are released and can be embedded on your website.